Lead Poisoning – Still?
Yes! Lead poisoning remains the no. 1 environmental threat to children’s health in the United States.
The US Centers for Disease Control and Prevention estimate that approximately 500,000 children have blood lead levels (BLLs) at or above the blood lead reference value (BLRV) of 3.5 micrograms per deciliter (µg/dL).
Tennessee Childhood Lead Poisoning Prevention Program Common Lead Sources
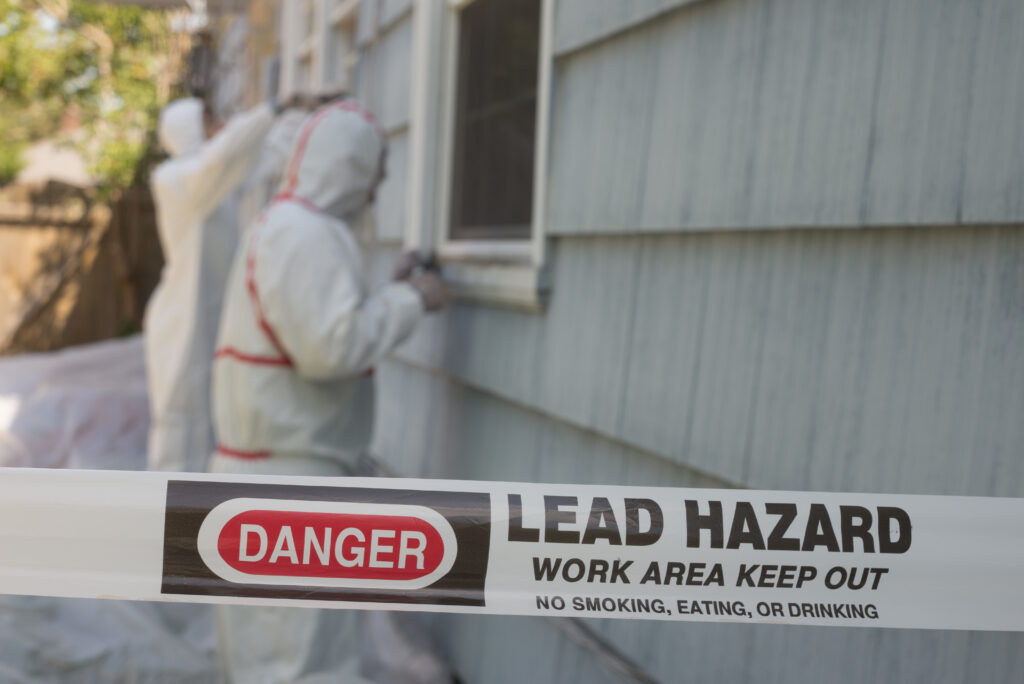
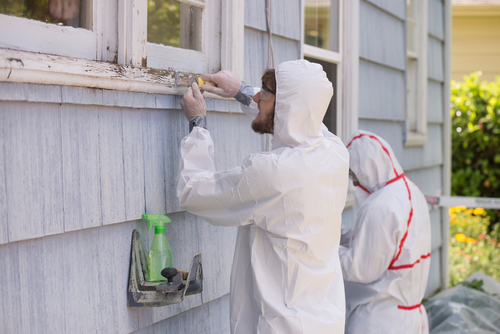
The source of lead poisoning for most American children is from the result of inhaling and/or ingesting lead-based paint dust in their own home. Chipping, peeling, or deteriorating paint and the dust particles left behind increases the risk of exposure.
According to a study conducted in 2020, 54 percent of the occupied single-family housing stock was built before 1980. Fifty-two percent of owner-occupied homes and 64 percent of renter-occupied homes were built before 1980**.
**M. Neal, L Goodman, C Young. Urban Institute. Housing Supply Chartbook, January 2020.

Additional Exposures

Soil

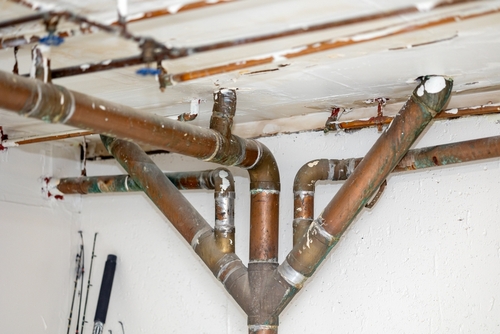
Plumbing

Occupations

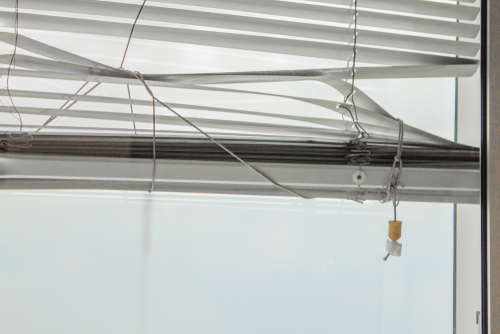
Blinds

Imported Cosmetics

Spices
Tennessee Zip Codes with 27% or more of homes built before 1950* by county
| County | Zip Code | Under 6 Population | Under 6 Population Percentile Rank † | % of Homes Built Earlier than 1950 |
|---|---|---|---|---|
| Anderson | 37830 37828 | 2067 12 | 89.2 10.3 | 31.1 39.1 |
| Blount | 37701 | 578 | 65.7 | 29.7 |
| Carroll | 38235 | 14 | 10.8 | 40.0 |
| Carter | 37682 | 0 | 0.0 | 100.0 |
| Davidson | 37206 37212 37213 | 2262 693 0 | 90.5 70.0 0.0 | 33.1 35.2 100.0 |
| DeKalb | 37095 | 185 | 41.5 | 26.8 |
| Fayette | 38046 | 0 | 0.0 | 100.0 |
| Franklin | 37318 37376 | 245 14 | 47.9 10.8 | 29.1 45.4 |
| Gibson | 38338 38389 | 10 1 | 10.2 8.0 | 52.0 35.3 |
| Marshall | 37047 | 67 | 22.7 | 26.7 |
| Grainger | 37848 | 0 | 0.0 | 57.3 |
| Hamilton | 37411 37407 37404 37402 37409 37350 37403 37351 | 1398 1261 1176 353 264 142 57 0 | 81.7 80.1 78.6 56.0 49.5 36.2 20.3 0.0 | 30.8 51.4 49.1 30.3 61.3 52.6 40.2 52.9 |
| Johnson | 37691 | 23 | 13.8 | 30.7 |
| Knox | 37917 37902 | 1531 0 | 83.6 0.0 | 51.6 50.4 |
| Lawrence | 38486 38457 | 86 70 | 26.0 23.3 | 32.2 28.5 |
| Lincoln | 38453 37733 | 40 0 | 16.0 0.0 | 34.2 100.0 |
| Overton | 38542 | 0 | 0.0 | 100.0 |
| Polk | 37333 37326 | 44 21 | 18.2 12.5 | 31.0 33.9 |
| Shelby | 38111 38122 38106 38108 38114 38112 38104 38107 38105 | 3562 3087 2222 1977 1648 1465 1120 1118 328 | 95.9 94.5 90.0 87.9 84.4 82.5 77.0 76.8 55.2 | 29.6 30.4 40.5 30.4 32.9 48.8 51.2 49.4 26.6 |
| Smith | 37057 38552 | 3 0 | 8.3 0.0 | 37.7 34.4 |
| Sullivan | 37665 | 462 | 61.0 | 33.9 |
| Warren | 37394 | 2 | 8.1 | 36.6 |
| Weakley | 38226 | 0 | 0.0 | 41.6 |
| White | 38587 | 50 | 19.4 | 29.1 |
† Inclusive percentile ranking among all Tennessee Zip Codes.
*The year 1950 is often used as a benchmark for housing at risk of lead poisoning because it represents the period when lead-based paint was most widely used in residential construction. After that, the amount of lead in paint began decreasing until it was totally banned in 1978 by the Consumer Products Safety Commission.
Data Source: American Community Survey 5-year Estimates Table B09001, 2021
The Importance of Lead Testing
Children are especially vulnerable to lead poisoning. This is because they absorb a much higher amount of lead. Their growing and developing bodies are more likely to be damaged by lead, particularly their brain.
Possible Physical Symptoms:
- Headache
- Sleep Problems
- Hearing Difficulties
- Upset Stomach/Intestinal
- Anemia
Possible Neurological and Socio-Behavioral:
- Reduced IQ
- Memory difficulties
- Poor hand and eye coordination
- Irritability
- Hyperactivity
- Agression
- Diminished academic performance


